
AI spending now rivals America's railway boom. Railway shareholders lost heavily
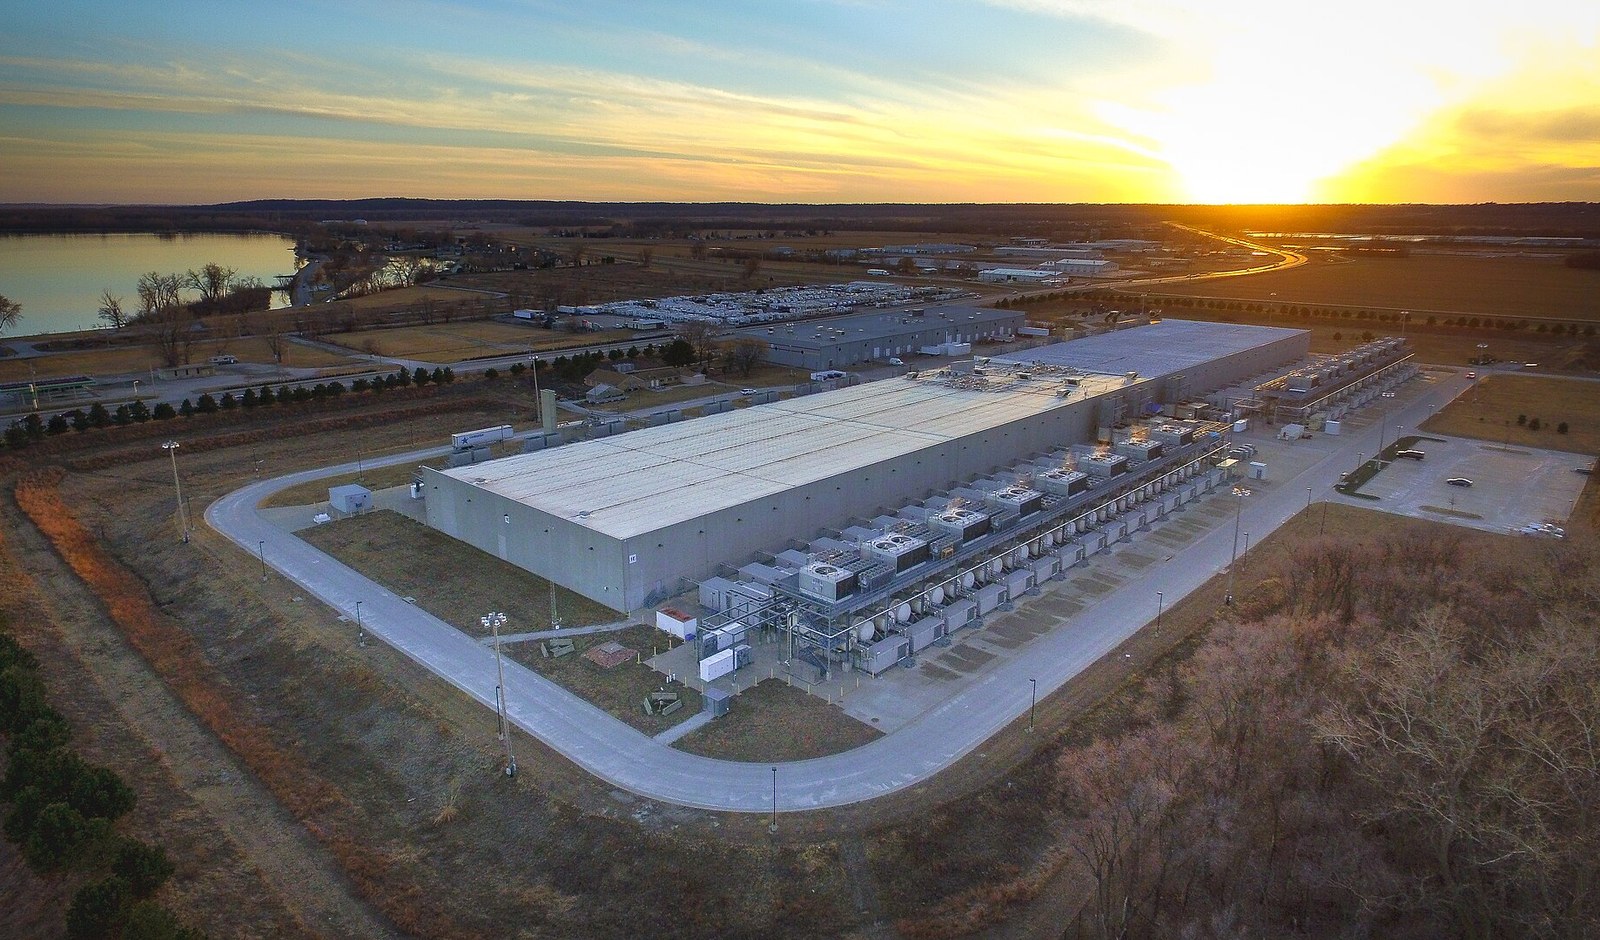
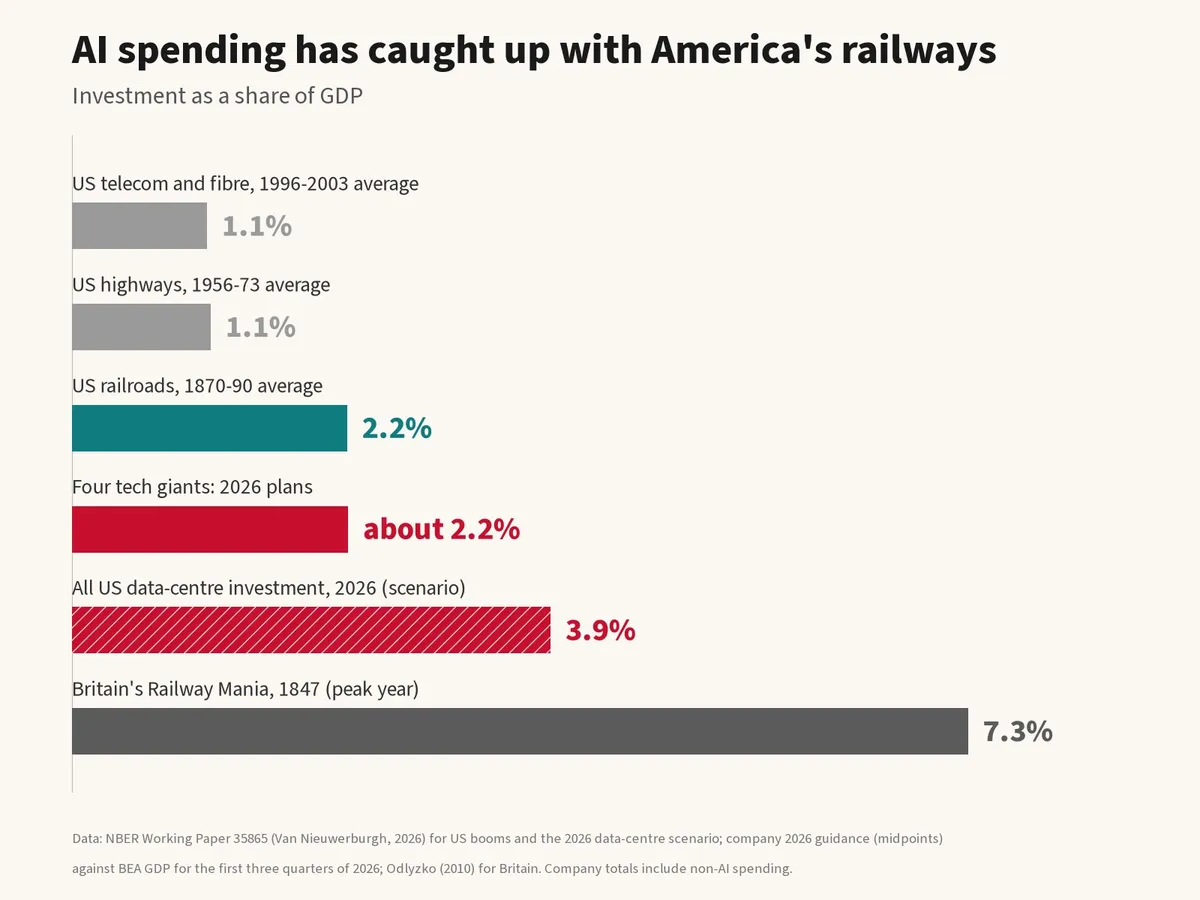
Microsoft, Alphabet, Meta and Amazon have told investors they will spend about $730bn on capital projects this year, much of it on data centres and the chips inside them. As a share of the economy, that is roughly what America put into its railways in their great building decades. The railway story has a famous ending for the people who paid for the track.
How big is the build-out?
The four gave their 2026 numbers with third-quarter results in late October. Amazon expects cash capital spending of about $220bn. Alphabet kept its range of $195bn to $205bn and said spending would "increase significantly in 2027". Meta narrowed its range to $135bn to $145bn, and Microsoft's finance chief, Amy Hood, said calendar-year spending "should be approximately $170 billion". At the midpoints, that is about $730bn.
The US economy ran at an annualised $32.5trn on average over the first three quarters of 2026, according to Bureau of Economic Analysis figures. Set against that, the four companies' plans come to about 2.2% of American GDP.
A National Bureau of Economic Research paper published in October by Stijn Van Nieuwerburgh of Columbia Business School compares past American building booms. Railroad construction averaged 2.24% of GDP from 1870 to 1890, and passed 4% in 1870 and 1881. Highway building averaged 1.13% from 1956 to 1973. The telecom and fibre boom of 1996 to 2003 averaged 1.10%, peaking at 1.39% in 2000.
Two caveats cut in opposite directions. The Federal Reserve noted in July that company capital spending includes non-AI projects and that much of the equipment is imported. But more data-centre capacity is now leased rather than owned, so headline figures can understate the build-out. Counting every American project, not just the big four, the NBER paper's central scenario puts data-centre investment at $1.25trn in 2026, or 3.9% of GDP, peaking near 5% in 2028 and averaging 3.22% to 2032. On that path AI passes America's railway boom. It would still trail Britain's: in 1847, the peak spending year of the Railway Mania, railway investment reached about £44m, or 7.3% of GDP, according to Andrew Odlyzko of the University of Minnesota.
The numbers, worked through
Each boom's share of GDP, applied to today's $32.5trn economy:
| Build-out | Share of GDP | In today's money |
|---|---|---|
| US telecom and fibre, 1996-2003 average | 1.10% | about $360bn a year |
| US highways, 1956-73 average | 1.13% | about $370bn a year |
| US railroads, 1870-90 average | 2.24% | about $730bn a year |
| Big four tech companies, 2026 plans | about 2.2% | about $730bn |
| All US data-centre investment, 2026 (NBER scenario) | 3.9% | $1.25trn |
| US railroads, peak years 1870 and 1881 | over 4% | over $1.3trn |
| Britain's Railway Mania, 1847 | 7.3% | about $2.4trn |
What happened to the railway shareholders
Britain built its network, and its shareholders paid for it. Odlyzko's index of railway shares fell from 167.9 at its peak in July 1845 to 60.5 in October 1849, a drop of almost two-thirds. By the end of 1850 investors had put about £250m into the railways and, on his estimate, lost about a third of it. Charlotte Brontë wrote that her York & North Midland shares, issued at £50, had risen to 120 and were "now down at 20". Even so, Odlyzko notes, hardly any lines went bankrupt, almost all stayed in service, and Britain probably gained as a nation, because the benefits to users outweighed the shareholders' losses.
America's version ended in a bank panic. Investors in many early railroads earned high returns, the Federal Reserve's history of the period says, but new projects outpaced demand and returns fell. When European investors dumped American railroad bonds in 1873, many lines could not refinance and failed. Jay Cooke & Co., the bank behind the Northern Pacific, collapsed on September 18. Two days later the New York Stock Exchange closed for the first time in its history, for ten days; at least 100 banks failed. A depression followed that lasted until 1879.
The fibre glut
The telecom boom was smaller relative to the economy. Spending on communications equipment rose from about $62bn a year in early 1996 to more than $135bn by late 2000, in 1996 dollars, according to a Federal Reserve Bank of Richmond study. The Nasdaq telecom index went from 198 in April 1997 to 1,230 in March 2000, then fell to 136 by May 2003. S&P telecom companies lost about $700bn of market value between 2000 and 2002. A trade magazine quoted in the study warned in February 2001 that nearly 600,000 miles of new inter-city fibre was on the way as capacity prices dropped.
Who is making money this time
So far, the seller of the shovels. Nvidia's data-centre revenue was $89.0bn in the quarter to late July, up 117% on a year earlier, and the company's gross margin was 75%.
The buyers are stretching. Alphabet spent $51.4bn on property and equipment in the third quarter against $42.3bn of operating cash flow, leaving free cash flow of minus $9.1bn. Meta's was minus $2.1bn. Amazon's free cash flow over the 12 months to September was minus $42.4bn. The NBER paper projects that capital spending by these four plus Oracle will exceed their combined operating cash flow in 2026 for the first time, with leases, private credit and special-purpose vehicles filling more of the gap. In Meta's Hyperion data-centre deal, about $27bn of a $30bn project was funded with debt.
Our take
The railway comparison is the right one, and most people take the wrong lesson from it. The railways were not a fraud. They worked, and the lines stayed in service. The people who lost were the ones who paid for them at the top. The people who won were the customers who used the network afterwards.
The same split is forming now, with one big difference. A railway line served for decades. The NBER paper assumes AI computing equipment has an economic life of about six years, and that it makes up about two-thirds of a new AI campus's cost. If demand comes in late, much of what is left behind is hardware that is already out of date.
The second difference is who is paying. In the 1840s it was private savers, from the Brontë sisters to Charles Darwin. Today it is companies that generate hundreds of billions of dollars of cash a year and can absorb a lot of pain. But their spending now runs ahead of that cash, and more of the bill is moving into leases and project debt that do not sit fully on their balance sheets. That is where losses would land first.
None of this means the build-out is wrong. It means the returns may go to whoever sells the equipment and whoever buys cheap computing after a glut, not to whoever builds the most.
What to watch: 2027 spending plans, which Alphabet has promised with its fourth-quarter results, free cash flow at the big four, and the hourly price of renting a top-end chip.
Sources
- Microsoft, FY27 first-quarter earnings conference call (October 28, 2026)
- Alphabet, Q3 2026 earnings release, exhibit 99.1 to Form 8-K (October 28, 2026), SEC EDGAR
- Amazon, Q3 2026 earnings release, exhibit 99.1 to Form 8-K (October 29, 2026), SEC EDGAR
- Meta, Meta reports third quarter 2026 results (October 21, 2026)
- Nvidia, Financial results for second quarter fiscal 2027 (August 26, 2026)
- US Bureau of Economic Analysis, Gross domestic product, third quarter 2026 (advance estimate) (October 29, 2026); quarterly levels via FRED series GDP, Federal Reserve Bank of St. Louis
- Paul E. Soto, Mason Thieu and Jeffrey S. Allen, The AI buildout and the economy, FEDS Notes, Federal Reserve Board (July 17, 2026)
- Stijn Van Nieuwerburgh, Financing the AI buildout, NBER Working Paper 35865 (October 2026)
- Andrew Odlyzko, Collective hallucinations and inefficient markets: the British Railway Mania of the 1840s, University of Minnesota (2010)
- Federal Reserve History, Banking panics of the Gilded Age
- Elise A. Couper, J. P. Hejkal and Alexander L. Wolman, Boom and bust in telecommunications, Federal Reserve Bank of Richmond Economic Quarterly (Fall 2003)
- CNBC, Alphabet holds 2026 capex unchanged, expects significant increase in 2027 (October 28, 2026)
- Chart and table: The Graze, calculated from the sources above