
More billionaires, less poverty? What the 64-country chart does and doesn't show
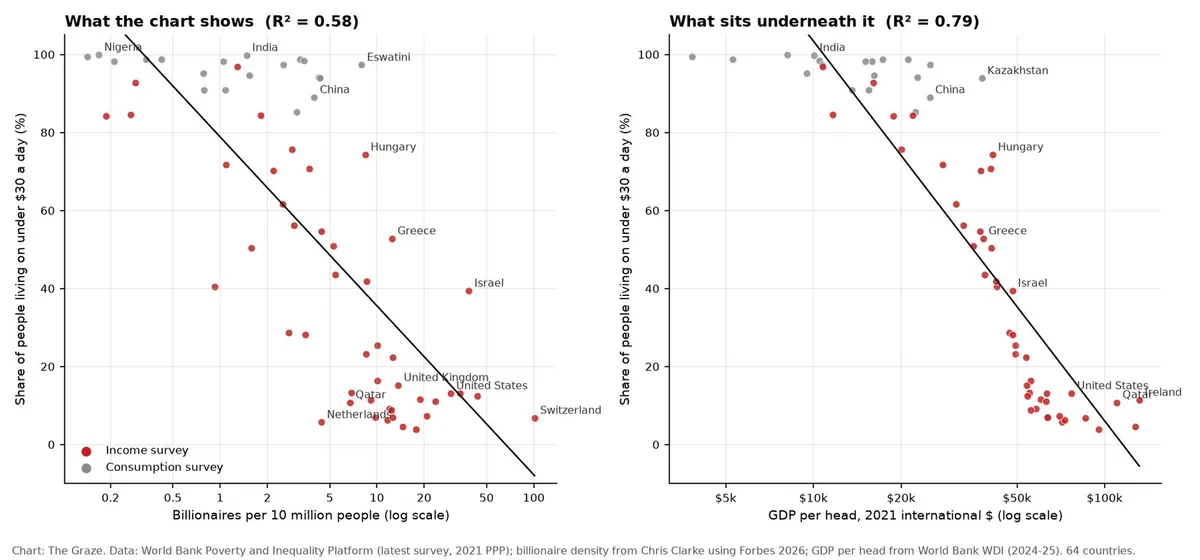
A chart doing the rounds makes a tidy claim: where billionaires are common, poverty is rare. Built by the economist Chris Clarke from Forbes's 2026 billionaire list and the World Bank's Poverty and Inequality Platform, it plots 64 countries: billionaires per 10 million people against the share of people living on less than $30 a day. Nigeria and India sit top left, Switzerland and the United States bottom right.
We downloaded the data and checked it. The numbers are right. What they mean is another matter.
What the chart actually says
The fitted line is poverty = 78.9 − 43.3 × log10(billionaires per 10 million). In plain English, every tenfold increase in billionaire density goes with 43 percentage points less poverty. The fit explains 58% of the variation between countries, and the rank correlation is −0.79. We re-ran it on Clarke's data and got the same result; the poverty figures match the World Bank's database.
Forbes counted a record 3,428 billionaires this year across 80 countries and territories: 989 in the United States, 539 in China, 229 in India. Per head, that is about 30 per 10 million Americans, about 1.5 per 10 million Indians and, at the top of the chart, about 101 per 10 million Swiss.
Problem one: $30 a day is not poverty as the World Bank defines it
The World Bank's international poverty line, reset in June 2025, is $3.00 a day in 2021 prices. Its lines for lower- and upper-middle-income countries are $4.20 and $8.30. Separately, it uses $28 a day as a "prosperity standard", roughly the income at which a country moves from upper-middle to high income. So $30 a day does not measure destitution. It measures how many people have not yet reached a rich-country standard of living.
On the World Bank's figures, 99.9% of Indians lived on less than $30 a day in 2023, but 2.6% lived on less than $3. In Nigeria the numbers are 99.9% and 41.8%. Using the $3 line on the same countries (63 with national data), billionaire density explains just 15% of the variation, not 58%.
Problem two: billionaires mostly stand in for national income
Rich countries have more billionaires and fewer people below $30 a day; across these 64 countries, billionaire density and GDP per head correlate at 0.79. So we added World Bank GDP per head (2021 international dollars) to the regression.
| Model | Variation explained | Poverty change per tenfold billionaire density |
|---|---|---|
| Billionaire density only (the chart) | 58% | −43.3 points |
| GDP per head only | 79% | not in model |
| Billionaire density and GDP per head | 80% | −8.8 points (not statistically significant) |
| Both, plus survey type | 84% | −11.3 points |
Income per head alone beats the chart, explaining 79% of the variation. Once it is held fixed, the billionaire effect shrinks by three-quarters or more, to between 9 and 11 points per tenfold. Put another way: doubling income per head goes with about 25 points less poverty; doubling billionaire density at the same income goes with about 3 points.
Problem three: the fine print
- Survey type. Poorer countries tend to measure consumption, richer ones income. With income and billionaires held fixed, consumption-survey countries sit about 21 points higher, so part of the slope is a change of yardstick.
- Old surveys. The latest survey for Hungary and Qatar is 2017, and for Eswatini 2016, set against a 2026 billionaire count.
- A straight line on a log scale. Clarke's line hits zero poverty at about 66 billionaires per 10 million people. Switzerland, at 101, should have negative poverty. It has under 7%.
The exceptions are instructive. Israel has more billionaires per head than the US (38.5 per 10 million) but 39.4% of its people below $30 a day. The Netherlands has 4.4 per 10 million and 5.7% below.

What other research finds
The economist Blair Fix, using Forbes data for 2021-22, found that GDP per head on its own explained about 61% of the variation in billionaire numbers between countries. Billionaires, in other words, are largely a function of how rich a country already is.
The more useful work asks where the money came from. Sutirtha Bagchi and Jan Svejnar, using Forbes lists from 1987 to 2002, found that more billionaire wealth relative to the economy went with slower growth. Split by source, the drag came almost entirely from fortunes built on political connections; the rest had no significant effect. Countries with billionaires in every year of their sample but no connected ones included Britain, the Netherlands, Sweden and Switzerland.

Our take
The chart is honest data and a misleading argument. It does not show that billionaires reduce poverty. It shows that rich countries have more billionaires and fewer people below a rich-country income line. Hold income fixed and three-quarters or more of the effect disappears. Billionaires are a symptom of deep capital markets, large companies and high incomes, not the cause.
Both sides of the billionaire argument are asking the wrong question. A tenfold rise in billionaires does not buy 43 points of poverty reduction, and on this evidence a billionaire tax would not wreck a country either. The variable that matters is how the money was made. Founders who build companies in open markets show a country rewards building things. Tycoons enriched by licences, privatisations and state contracts show the opposite, and the research says those fortunes cost growth.
So when someone quotes the number of billionaires in a country as a scorecard, ask a better question: what share of that wealth would survive real competition? Switzerland and Sweden would score well. Plenty of countries in the middle of this chart would not.
What to watch is change within countries over time, not snapshots between them. If India and Indonesia keep adding billionaires while their $8.30-a-day poverty falls, the optimists have a better argument than this chart. If the billionaires multiply and the poor stay put, the fortunes are coming from the wrong place.
Sources
- Chris Clarke, Where billionaires are common, poverty is rare, interactive chart and data table (Forbes 2026, World Bank PIP)
- World Bank, Poverty and Inequality Platform, headcounts at $30 and $3.00 a day, latest survey per country (2021 PPP)
- World Bank, June 2025 update to global poverty lines
- World Bank, Prosperity gap indicator definition, $28-a-day prosperity standard
- World Bank, GDP per capita, PPP (constant 2021 international $), World Development Indicators
- Forbes, The countries with the most billionaires 2026
- Blair Fix, Billionaires are so predictable, Economics from the Top Down
- Sutirtha Bagchi and Jan Svejnar, Billionaires and growth, Milken Institute Review, summarising their 2015 Journal of Comparative Economics paper
- Regressions and chart: The Graze, from the sources above