

JPMorgan's midterm cheat sheet: the likeliest result pays least
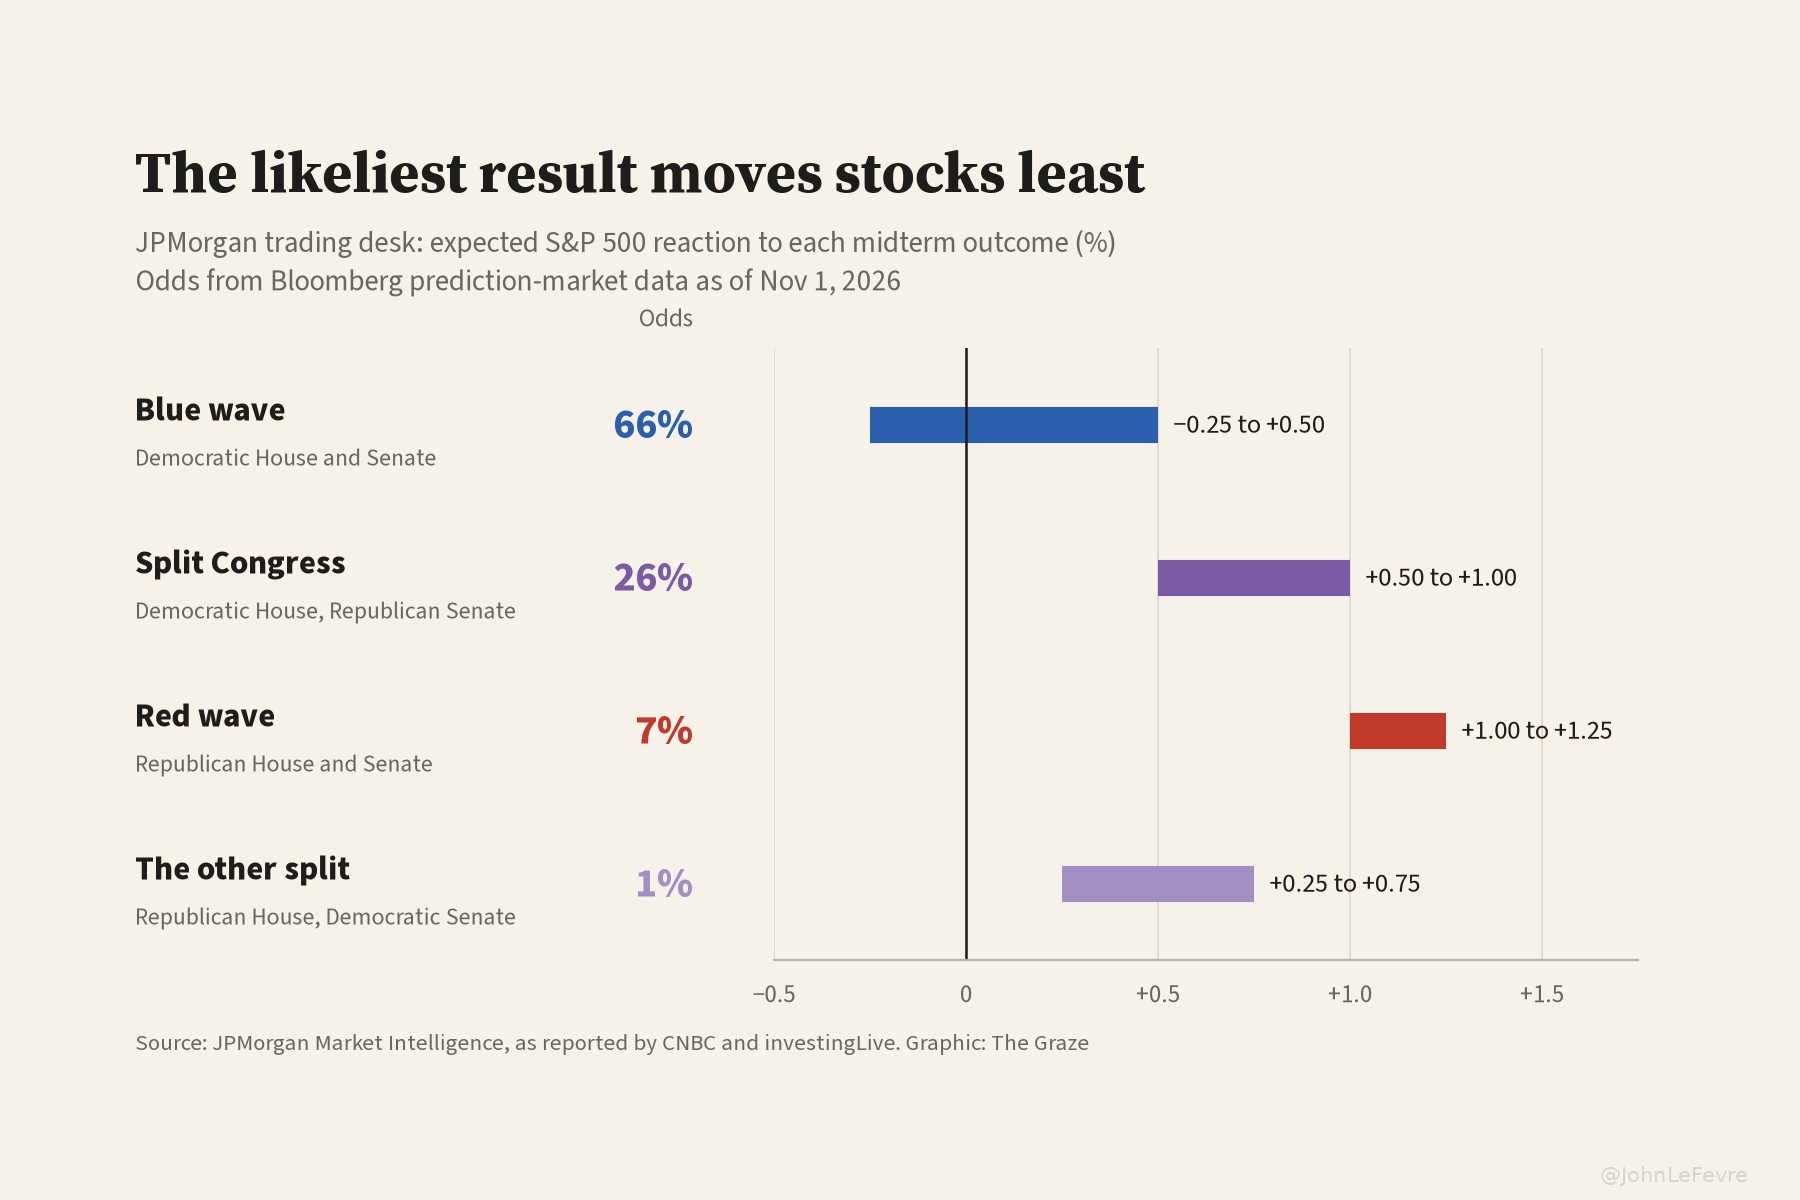
Americans are choosing a Congress today, and JPMorgan's trading desk has already told clients what happens next. Its answer is a paradox: the result the market thinks most likely is the one stocks like least, and the result stocks like most is the one almost nobody expects.
The bank's Market Intelligence team mapped four outcomes against Bloomberg prediction-market odds as of Nov. 1, investingLive reported. ZeroHedge's one-page version of the note has been seen almost two million times on X. The rule it implies is simple: the more of Congress Republicans keep, the better stocks do, and the Senate counts for more than the House.
The map
Blue wave, 66%. Democrats take the House and the Senate. JPMorgan sees the S&P 500 anywhere from 0.25% lower to 0.5% higher, the only range with a minus sign.
Split Congress, 26%. Democrats win the House and Republicans keep the Senate. Stocks rise 0.5% to 1%.
Red wave, 7%. Republicans hold both chambers. Stocks rise 1% to 1.25%, the best of the four.
The other split, 1%. Republicans keep the House and Democrats take the Senate. Stocks rise 0.25% to 0.75%.
Weight each range's midpoint by its odds and, on The Graze's arithmetic, the expected move is about 0.36%. That is the real message. A two-thirds favorite is mostly priced in. The money is in being wrong.
Why a blue wave is a shrug
The obvious fear in a Democratic sweep is for AI. Data centers have become a campaign issue, and a Democratic Congress could go after them. JPMorgan thinks the fear is overdone: Trump will not sign bills that limit AI, and Democrats will not have a veto-proof majority. Its advice to AI bulls is to buy any dip. Its warning is that investors may still cut exposure within the AI trade without leaving it.
The desk flags two other consequences. One is "investigation risk": a Democratic Congress could look into Trump-linked donors, a group that includes large technology companies. The other is in bonds. With Democrats controlling the government's finances, JPMorgan expects lower deficit spending and slightly lower long-dated Treasury yields.
In CNBC's Election Day preview, analysts named defense a likely loser from a blue wave and healthcare a likely winner. Goldman Sachs strategists said a Democratic Congress "might limit data center tax incentives, but a national moratorium looks unlikely in any election outcome."
Why markets pay for gridlock
The split Congress is the result equity investors would pick. Democrats would still control the purse, so JPMorgan expects deficit spending to fall and long-end yields to ease. A Republican Senate, though, effectively removes impeachment risk: the House can impeach, but only the Senate can convict. Gridlock would bring budget fights in 2027, but the desk notes that shutdowns have had limited economic impact.
History agrees. A CNBC analysis of elections since 1980 found the S&P 500 averaged a 15% gain in the year after elections that left no single party in charge, against 11.5% after single-party control. "If you have a huge red wave or a big blue wave, markets actually kind of don't like that as much," said Ryan Detrick, chief market strategist at Carson Group.
The 7% trade
So why does a red wave top JPMorgan's table? Because it changes nothing. The status quo brings no new regulatory risk, and that is worth up to 1.25%.
It is not free. JPMorgan expects deficits to stay high and long-end yields to rise. A red wave could also embolden Trump to continue the Iran campaign until there is a US-friendly deal or Iran capitulates. With crude up more than 10% in October and gasoline averaging $4.17 a gallon, according to AAA figures cited by CNBC, a longer war is no footnote.
What the cheat sheet leaves out
The first omission is the starting point. The S&P 500 has posted double-digit gains in 2026. Jonathan Krinsky, chief market technician at BTIG, notes that stocks often do well in November of a midterm year because they are typically weak going into the vote. "We have the opposite setup this year," he wrote. "We think the opposite is actually more likely."
The second is the tail. JPMorgan's ranges are tidy because they model clean results. Evercore ISI's worst case is not. If Democrats take Congress and Trump escalates in Iran before the new Congress is seated in January, it sees the S&P 500 ending the year at 6,800, a double-digit fall.
Investors may not believe the odds anyway. Tobin Marcus, head of US policy and politics at Wolfe Research, told CNBC that investors have "a significant dose of skepticism about whether the final outcome is going to be quite as favorable to Democrats as the polling suggests." If they are right, the upside is in the outcomes the odds dismiss.
Over a longer horizon, the party barely matters. The S&P 500 was higher a year later after all 11 midterms from 1982 to 2022, and the average one-year gain since 1980 is 13.7%. JPMorgan's cheat sheet is a guide to Wednesday morning, not to 2027. Tonight decides which row of the table traders get. History says the bigger number comes a year later.