
Going out costs more than ever; staying in keeps getting cheaper
Going out has got about 20% more expensive since 2000. Staying in has got about a quarter cheaper.
That is the finding of a Financial Times chart by John Burn-Murdoch, which did the rounds on X this week after @unusual_whales posted it with the line "Going out has become more expensive, staying in has become cheaper." That post has been seen more than 200,000 times.
The chart tracks inflation-adjusted prices for two baskets of US goods and services, with 2000 set at 100. By 2025, going out sits at about 120. Staying in has fallen to about 74.
Going out, in the FT's definition, means restaurant food and drink and event tickets. Staying in means groceries, TV, video and music, video games, internet, devices and software. The sources are the US Bureau of Labor Statistics' consumer price index and its Consumer Expenditure Survey.
We went to the BLS data ourselves to see what sits underneath.
The numbers behind the lines
We compared annual average prices in 2000 with 2025 for the individual items, using the BLS's urban consumer price index. Overall prices rose 87% over the period. Everything below is after taking that out.
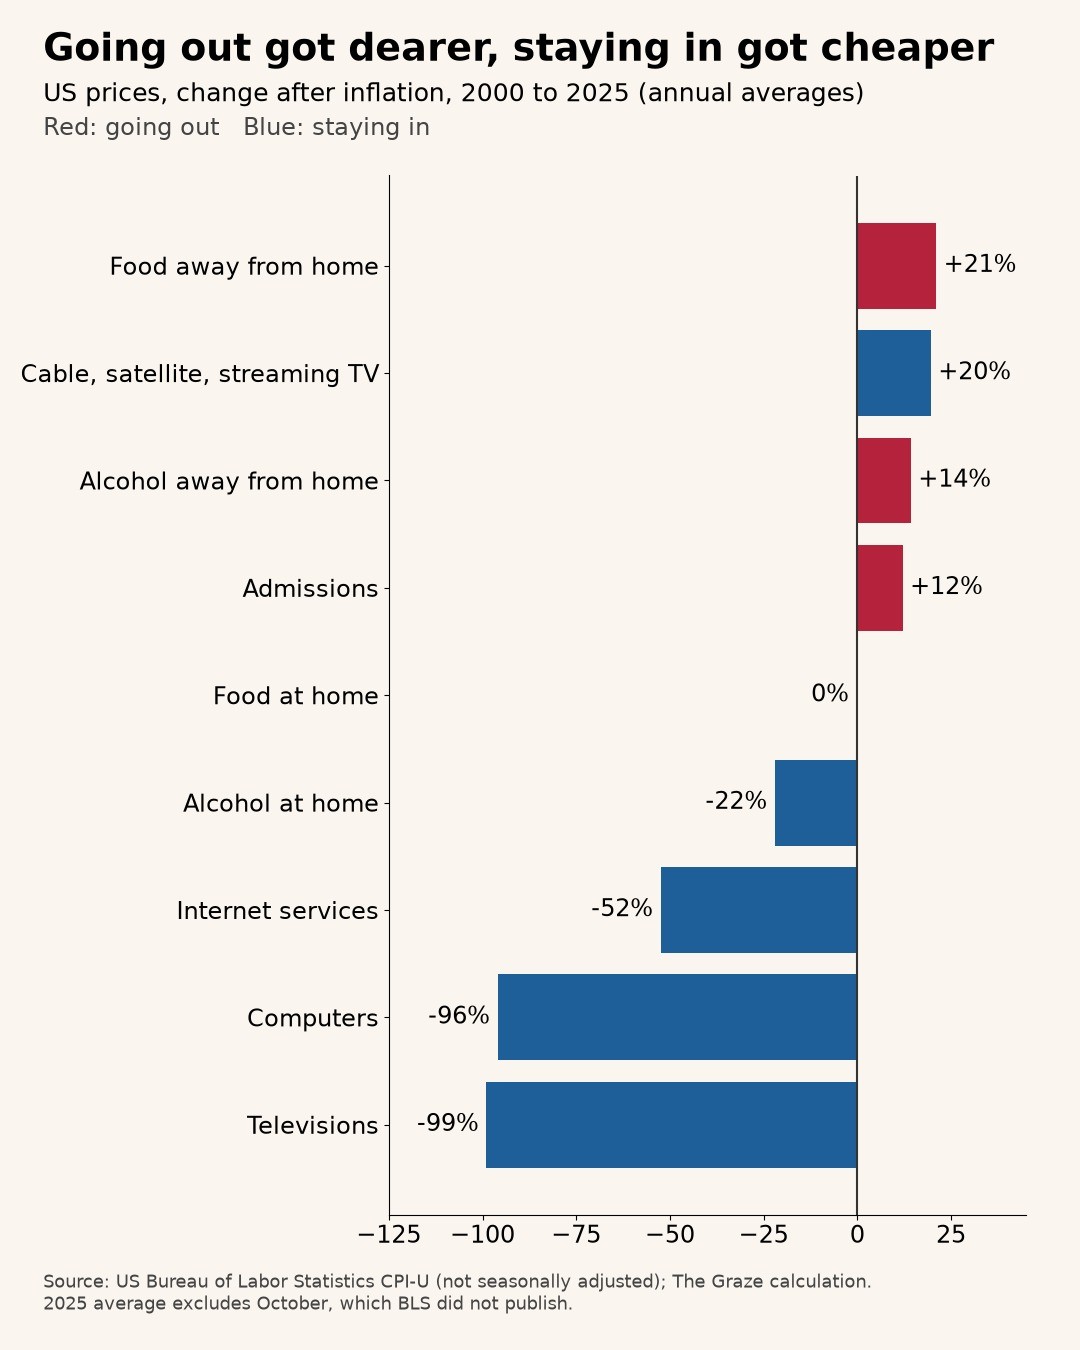
Food away from home, meaning restaurants, takeaways and the like, is up 21% in real terms. In plain dollars it has more than doubled, up 126%.
Admissions, the BLS category for tickets to films, shows, sports and other events, is up 12% after inflation.
Alcohol bought in bars and restaurants is up 14% in real terms.
Now the other side.
Food at home, your groceries, has gone nowhere after inflation: down 0.2%. Over 25 years, groceries have tracked prices in general almost exactly.
Alcohol bought to drink at home is down 22% in real terms. In dollars it is up 46%, barely half the rise in prices generally. The gap between a beer at the bar and a beer from the shop has widened for a quarter of a century.
Then technology, which is where staying in got really cheap. Internet services are down 52% after inflation, and in dollars they are 11% cheaper than in 2000. The BLS index for computers is down 96% in real terms. Televisions are down 99%.
Those last two numbers do not mean a TV costs 1% of what it did. The BLS adjusts for quality, so a television today counts as far more TV than one from 2000. But that is the point. For the money, the screen in your living room has improved beyond recognition. The restaurant meal has not.
The twist: TV itself got pricier
There is one big exception on the staying-in side. Cable, satellite and live streaming TV service is up 20% in real terms, almost exactly as much as eating out. In dollars it is up 124%.
So the television got almost free, and the thing you watch on it did not. Anyone who has added up their streaming subscriptions recently will not be surprised.
The FT's staying-in basket still falls because it is dominated by groceries, devices and the internet, all of which got cheaper or stayed flat.
Why going out costs more
The likely explanation is not a mystery. Restaurants, bars and event venues sell mostly people and space: staff, rent, a room full of tables. Those costs have risen with wages and property prices. There is no equivalent of Moore's law for a waiter.
Factories that make phones, laptops and TVs get better and cheaper at it every year. A software subscription costs the same whether one person uses it or ten million.
So the economy has, slowly and without anyone deciding it, made the sofa a better deal than the restaurant.
What it means
The chart is a neat explanation of a lot of modern life. Why ordering in feels sensible. Why a night out feels like an event. Why the TV keeps getting bigger and the dinner bill keeps getting longer.
It also explains why a dinner out can feel expensive even in a year when inflation looks tame. The night out is up about 20%. The night in is down about a quarter.
There are caveats. The FT's baskets are its own choice of categories. Our figures use 2025 averages that are missing October, which the BLS did not publish. And price indices measure prices, not how much fun you had.
But the direction is clear. Over 25 years, staying in got cheaper, and going out became a luxury.
The sofa won.
Chart: change in US prices after inflation, 2000 to 2025, annual averages. Source: US Bureau of Labor Statistics consumer price index for all urban consumers, not seasonally adjusted; The Graze calculation. 2025 averages exclude October 2025, for which BLS published no data. FT chart by John Burn-Murdoch described from the post linked above.